New Relic
Creating a scalable tech stack map
Observability | Devops | Maps
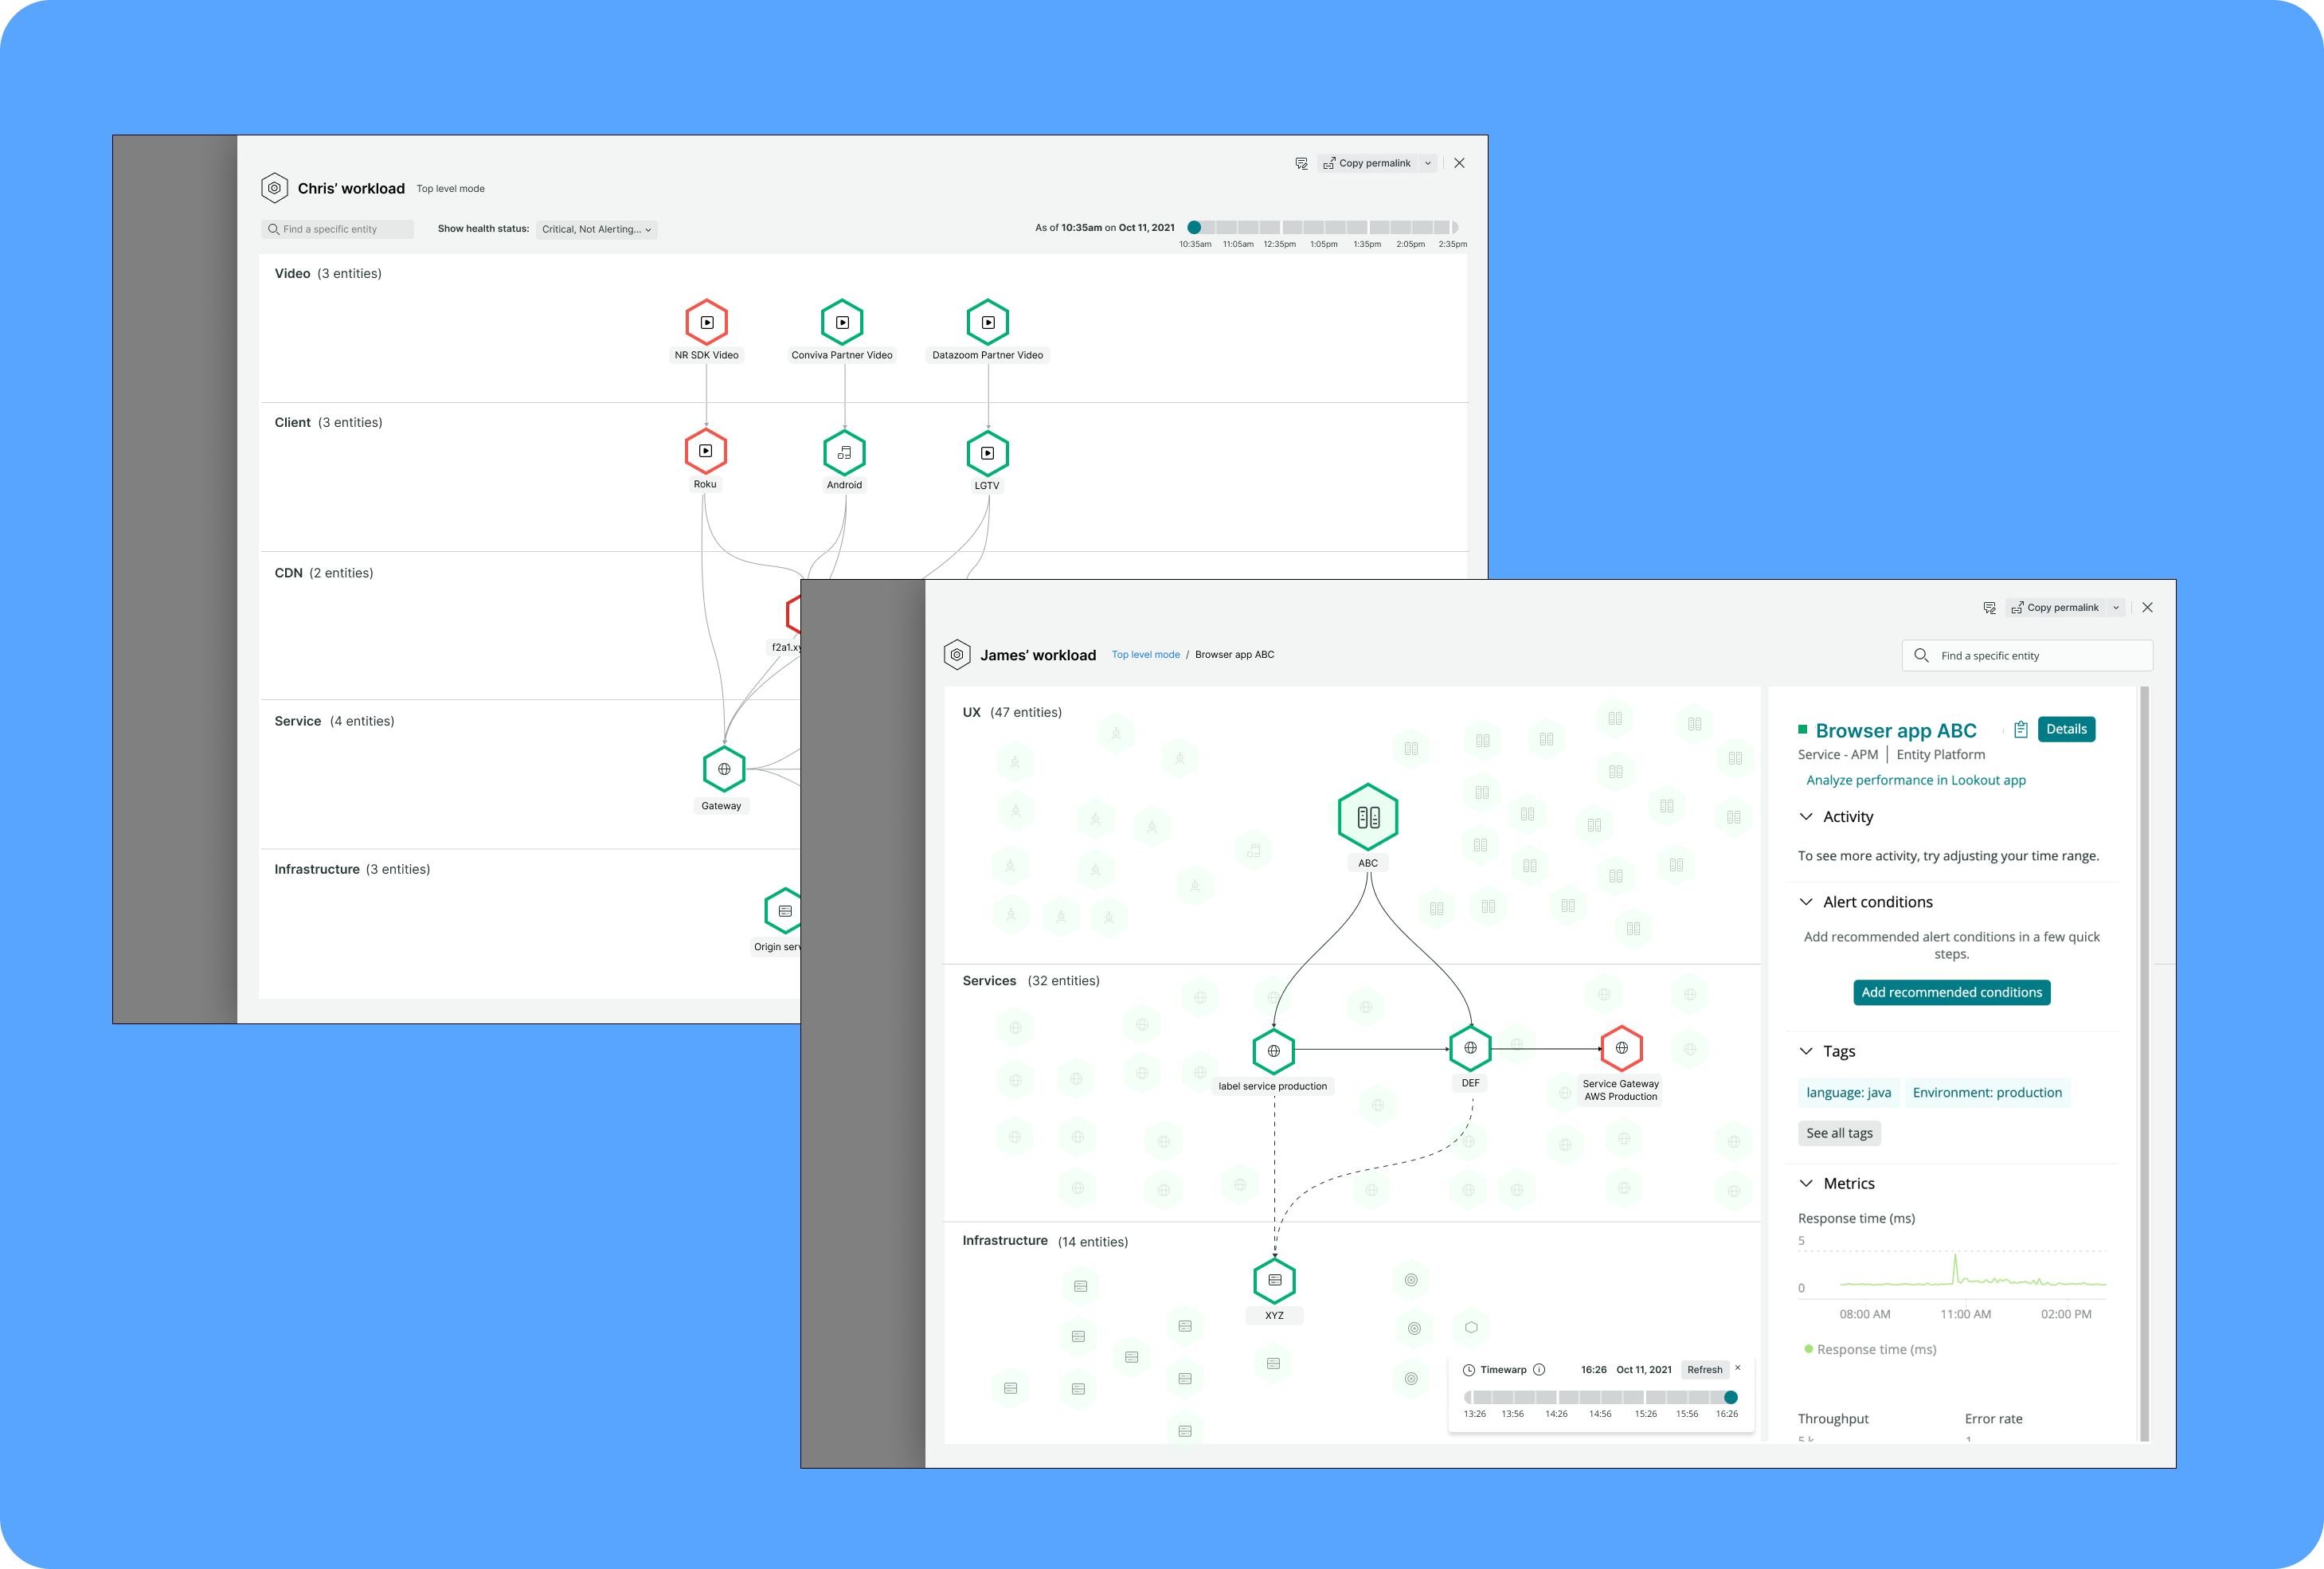
New Relic wanted to standardize a map system to visualize vast technology stacks
The target audience was devops and engineers who monitor their companies tech stack
My role
From 2022-23, I was the New Relic Incubation design team manager under GM Ari Zilka. Ari would spend a lot of time with customers learning about their problems. And then he would sell them a solution, before it existed.... cue the Incubation Team at New Relic. The team had a model to learn, create a proof of concept, and grow it quickly using a nimble 3-5 person pod of product, design and engineers.
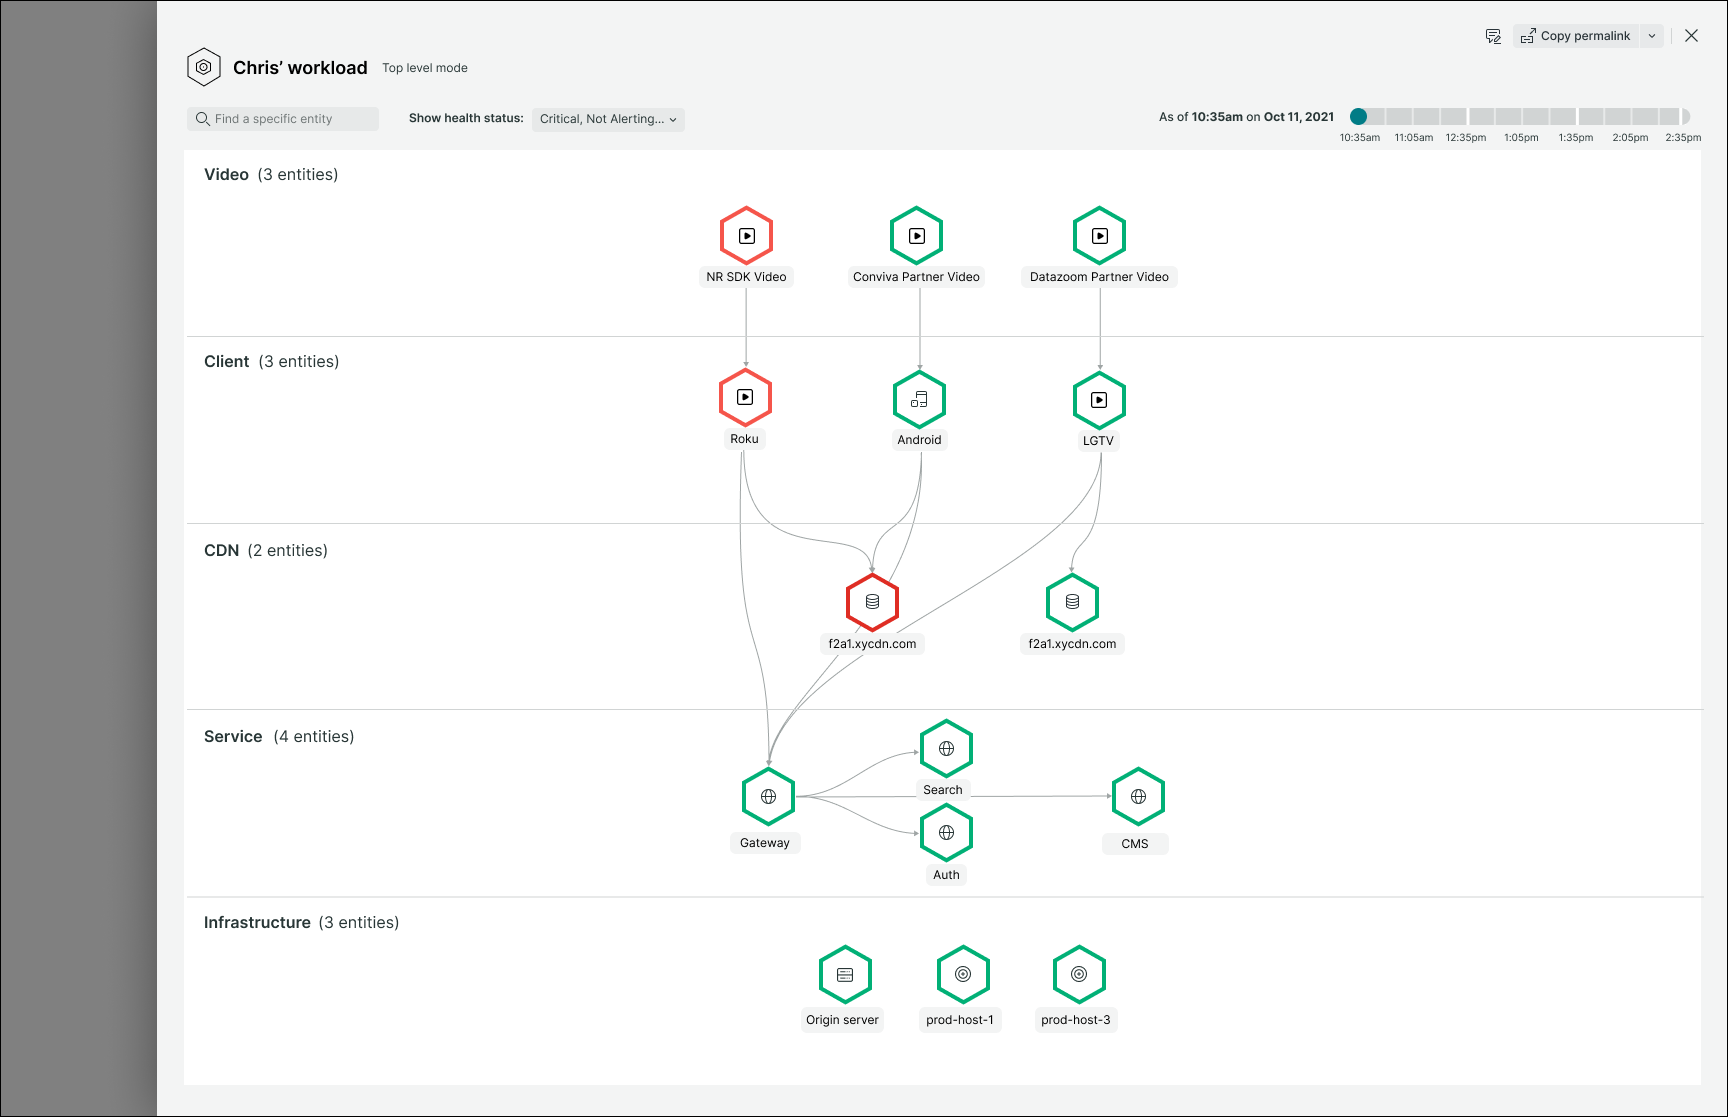
When I joined, the team had an incubation to create and scale a mapping system for large estates and provide quick ways to pinpoint issues, with the idea that these would replace New Relic's existing maps.
The maps debuted at the FutureStack customer conference in March 2022 and were rolled out to the entire platform by the end of 2023. Exciting stuff!
In addition to shaping the strategy, I played a role in the maps transitioning from an Incubation project a platform-wide capability.
I left New Relic when the Incubation team was disbanded in 2023. They were one of the smartest groups of people working on the toughest problems in Observability.
Responsibilities
Product design manager
Team lead
duration and output
A little over a year
Mapping system for the New Relic platform
Team
Product design manager (me)
Product designers (2)
Product manager
Engineers (2)
Problem STatement
How do we provide deeper context to vast technology stacks through mapping and topology?
Problem discovery
Tech stacks and signals are fluid
Bank of America wanted to see their entire estate at any given time
The goal was a dynamic map to visually communicate the structure and relationship of the system to drive faster outcomes in troubleshooting and dependency mapping.
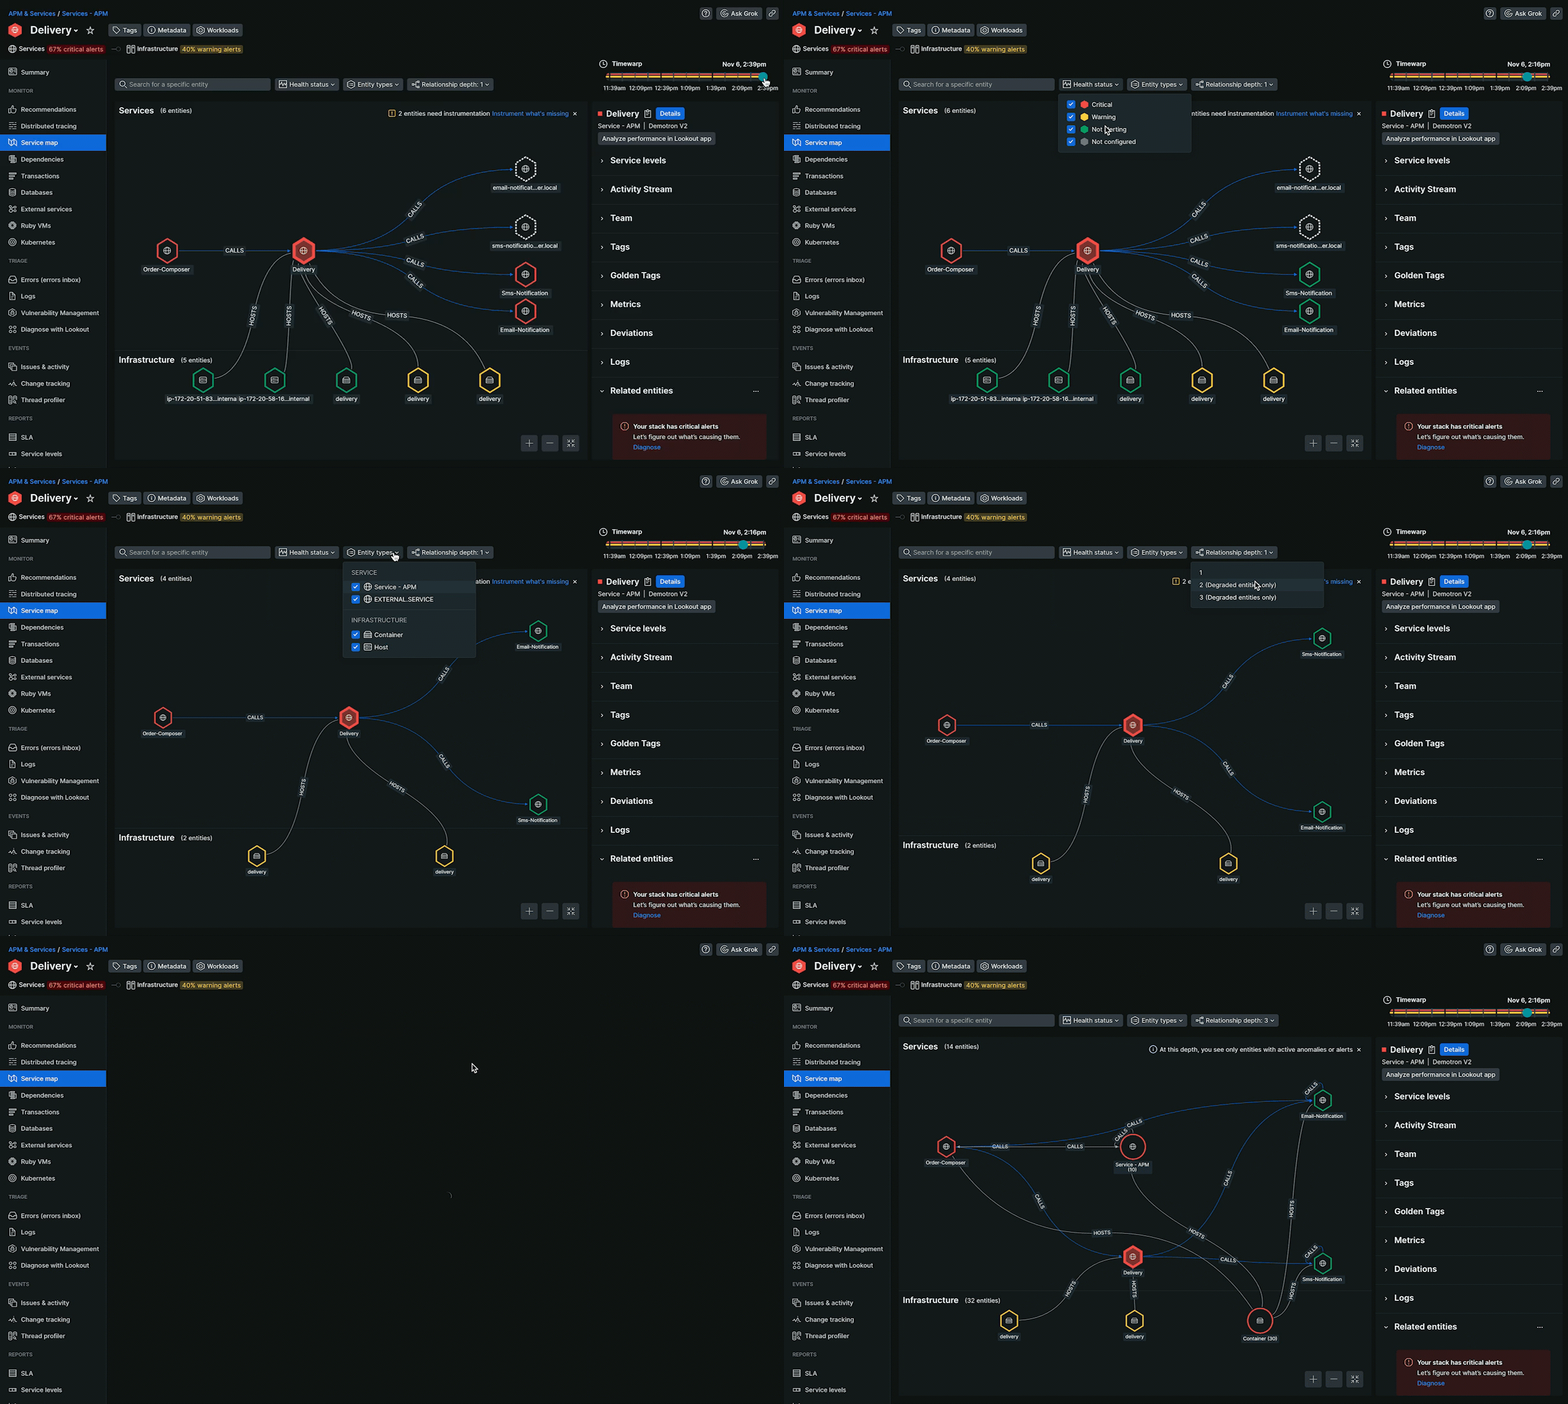
Design Process
We started with one design partner - Bank of America - and created a proof of concept. Then we worked with additional companies to expand upon the use cases.
A design language for the mapping system was created to represent the tech stack and scale.
Research and feedback sessions were used to refine the concept.
Designers
Initial desiger - Alan Florsheim
Primary designer- Norissa Clecky
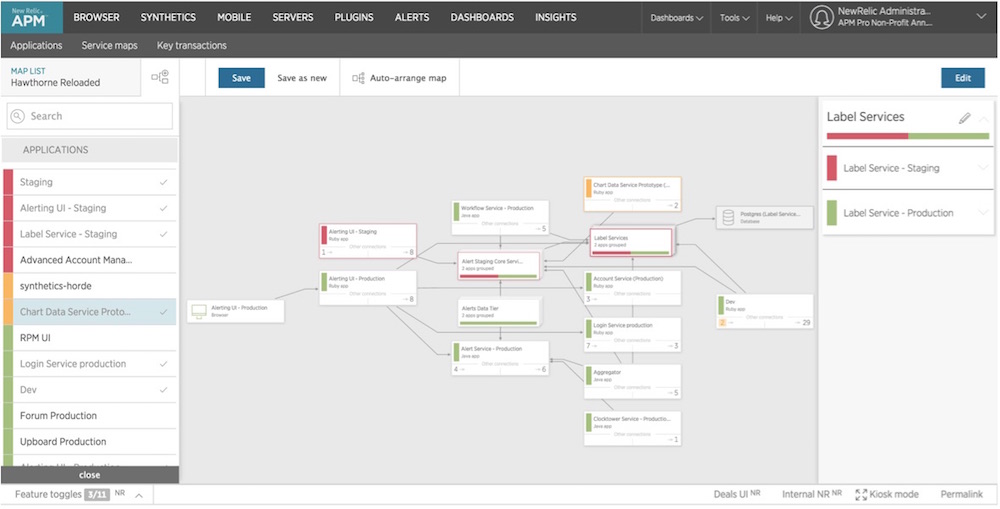
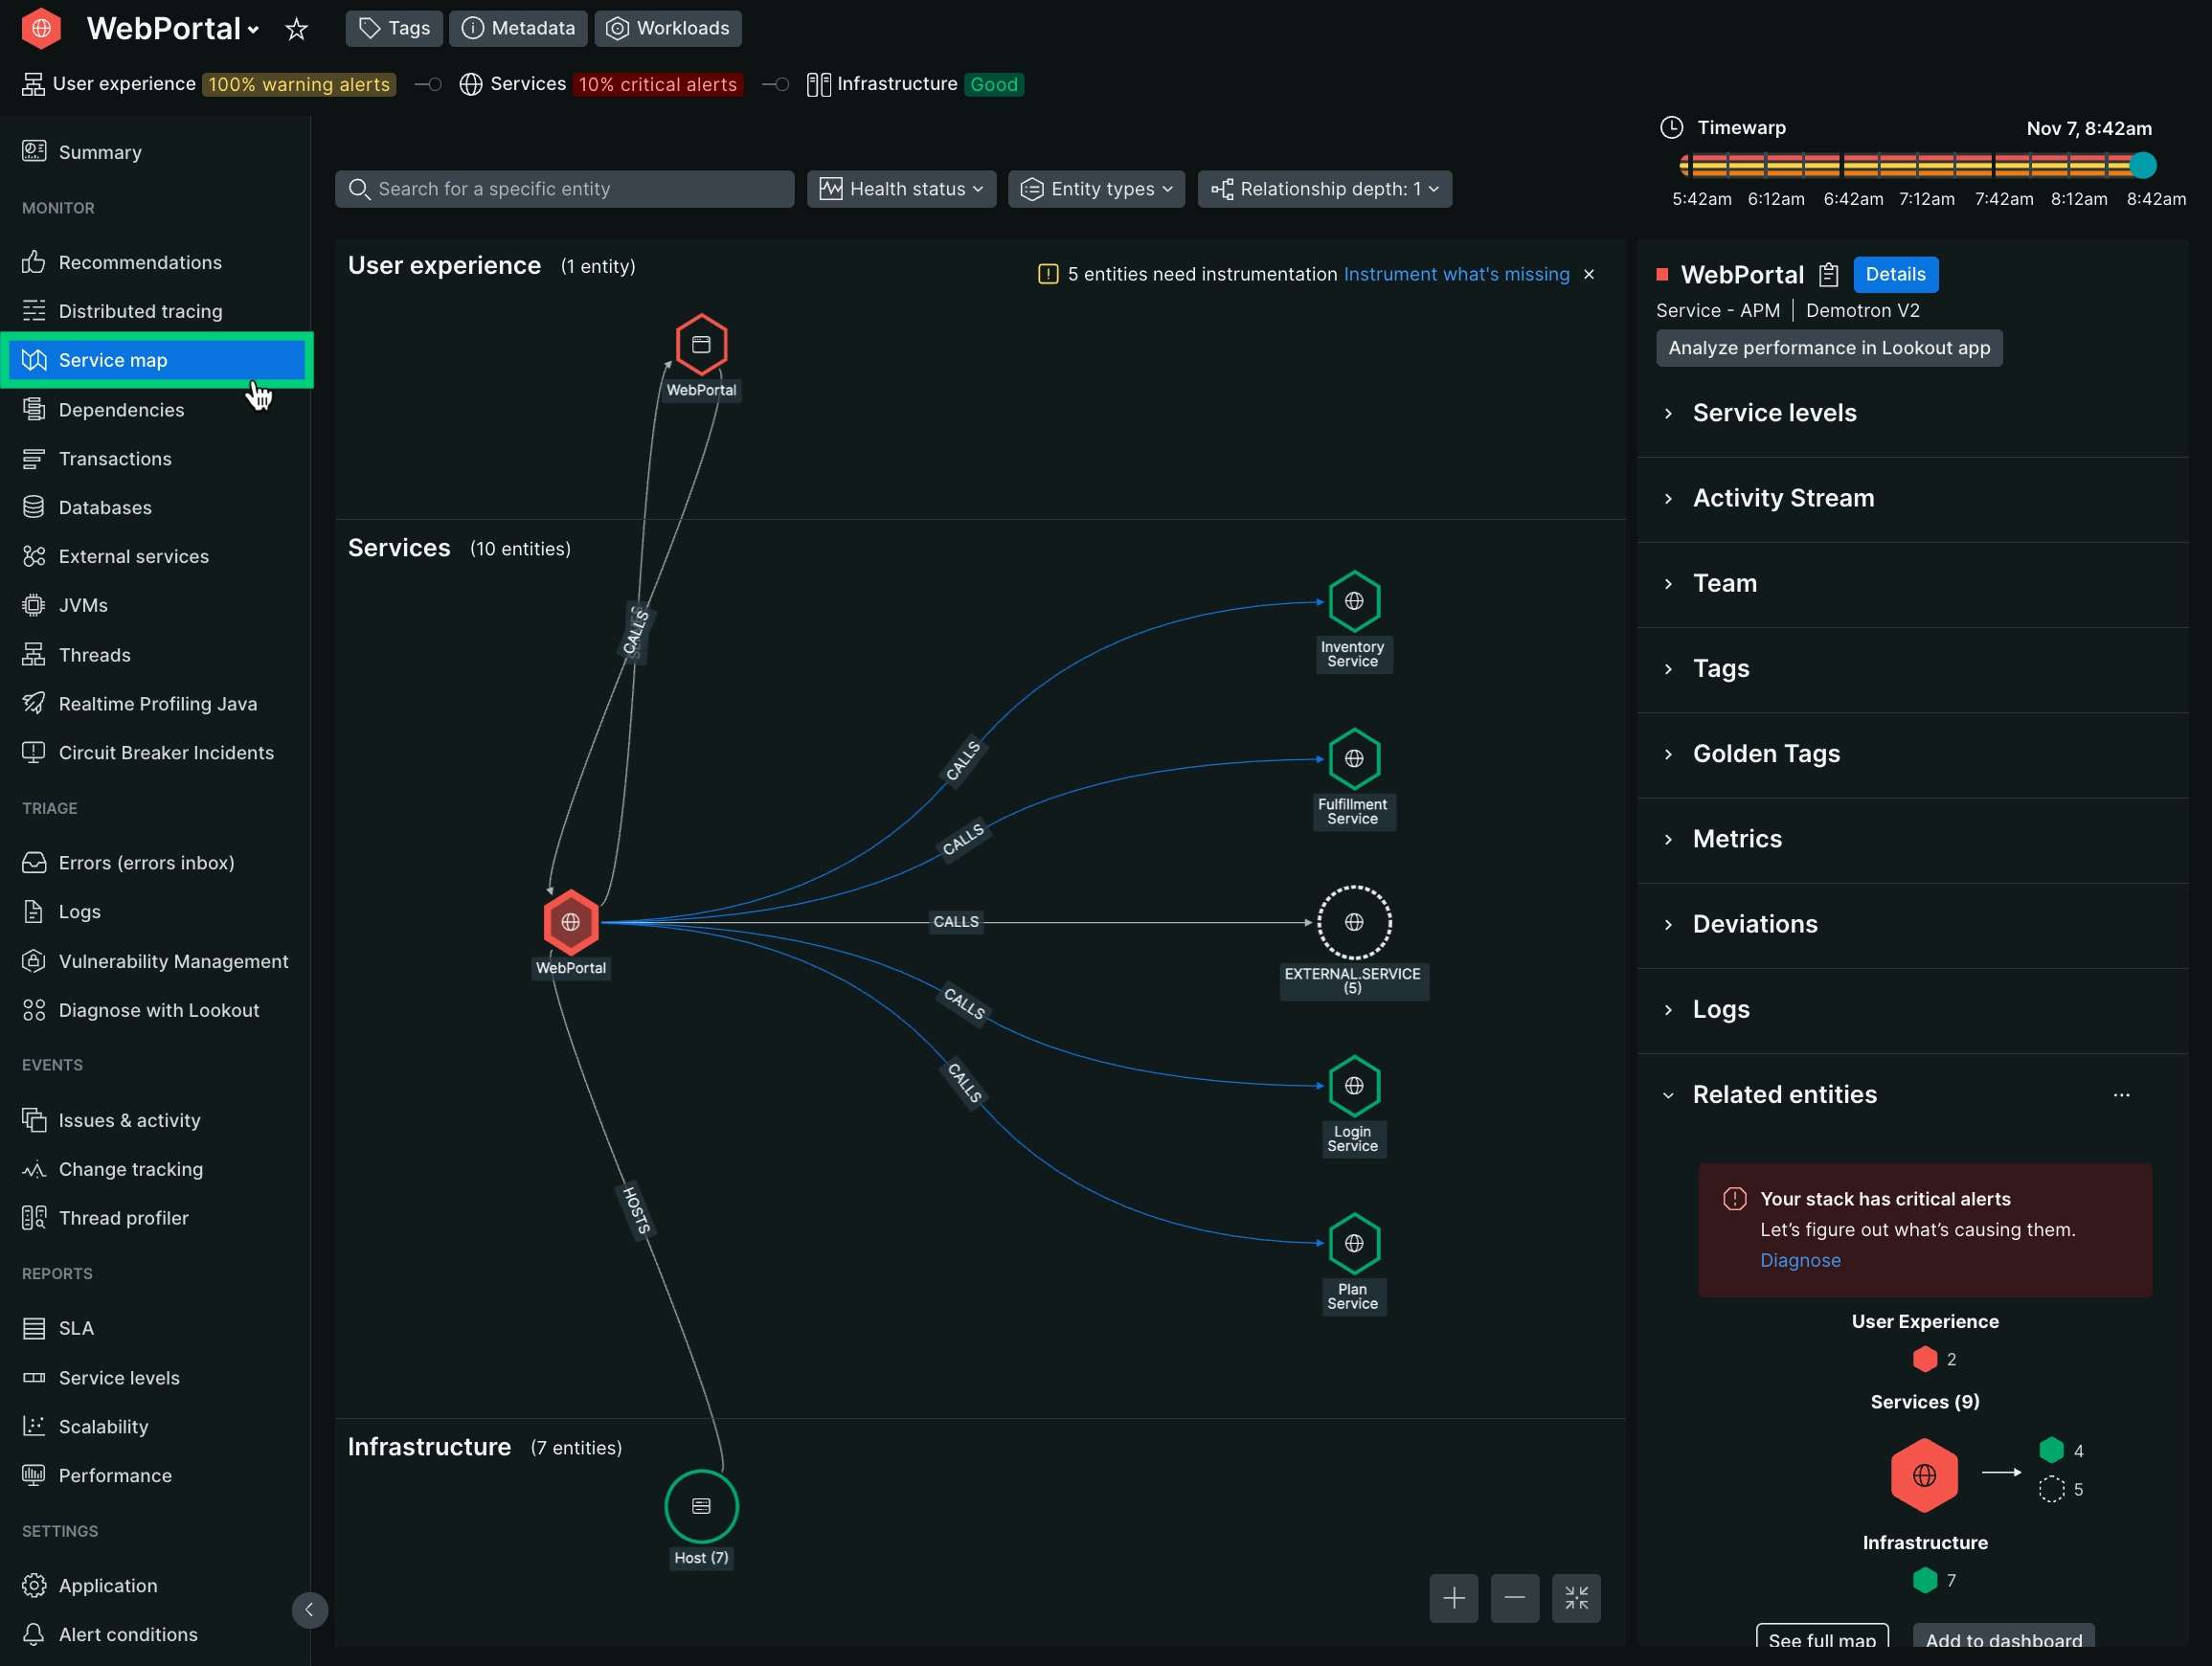
Before & After
Slide the arrow
What customer problems does a map view address?
- Troubleshooting
- Quickly identify and act on what’s critical
- Dependency mapping
- Entity health
- Telemetry & behavioral analysis in context
- Understand what isn't instrumented
Planning
• Speed up SRE & Architect discovery for new systems and projects
• Validate changes and prioritize instrumentation
Documentation
• Create a Realtime IT Catalog
• See the software architecture of your business processes
Usability
The visual representation of the tech stack are easy to understand, users can immediately discern the relationships and explore further.
Issue diagnosis
Time Warp - a slider that moves the map back and forth across time - allows users to see when an issue started, how their environment had changed, and relevant deployments.
Insights
User Research
We conducted exploratory interviews with customers and non-customers.
Overall Health of System
“So I could imagine this on a big screen in the team room....like this kind of war room display, you know, where you can see in a quick glance which systems are healthy and which aren't.”
- NR customer
Onboarding New Team Members
“... for onboarding ...when it comes to onboarding new team members, we have visuals on a confluence page...
And I don't think it's as interactive as this to... get an idea of what's going on.”
- Non-NR Customer
Challenges & Outcome
Challenges
The project underwent extensive iterations to scale it up to handle extreme use cases and vast estates. Incorporating the new design language for entities required remediating design and tech debt, and working across multiple teams.
outcome
The maps became the default for the New Relic platform in 2023. This was the result of a successful handoff from the Incubator team to the Platform team.
Missed opportunities
The map only focused on consolidating core APM and network services - it could have been expanded to provide points of entry into the full suite of New Relic tools.
Open to hearing about new opportunities
Get in touch via LinkedIn
© SARI HARRIS 2024